The very core of America’s automotive manufacturing dominance (Thomas, 2023) extends beyond the Big 3 OEMs (Ford, GM, and Stellantis), it is also found in the chain of Tier Automotive suppliers. Of the top 100 auto parts supply manufacturers in the United States, the first 20 collectively generate >$108B (Tenneco, 2021) in revenue. Across the country, over 2 million people are employed in auto manufacturing jobs, more than 80% work in supply manufacturing alone, (Alliance for Automotive Innovation, 2022) earning approximately $135B in payroll compensation. Needless to say, automotive suppliers manufacture the parts that drive the industry. The profits are costly, however, as major shifts in the industry are combining to hinder growth. Supply chain challenges, production changes from the OEMs, labor shortages, and external geopolitical dynamics are driving up suppliers’ costs. Bolt on the rise of the Electric Vehicle (EV) and industry adaptations for the suppliers are critical for future growth. Many suppliers are expanding their product portfolio, differentiating between Internal Combustion Engines (ICE) and EV, and increasing the products they sell to OEMs (Tominaga, et al., 2023). Others, ostensibly, can reassess their current state of business operations, relying on better analytics to trim the costs from already thin earnings. One of the strategies for big data analysis is utilizing Advanced Master Production Scheduling.
The following paper discusses how a tier automotive supplier might use existing operational, labor, and production related manufacturing data to build sophisticated machine learning models for predicting more accurate Master Production Schedules. The problem with master scheduling is due to the variabilities of the end-to-end supply chain and the randomness of workloads (Dormer Gunther Gujjula, 2013). The paper and associated data models will attempt to overcome the difficulties with scheduling by examining and learning from years of information, developing a method to plan labor, production, and equipment schedules that work congruently, giving suppliers clearer forecasts for the future. In choosing this effort, I am exploring a component of my business with the intent of piloting a process for helping my tier automotive manufacturing customers.
Project Structure
In the Automotive Industry the Master Production Scheduling (MPS) is one of the primary business drivers. Other schedules and calendars are utilized, most offer useful forecasts for immediate results. A complimentary schedule called Production Planning is like MPS in that both provide time-bound supply and demand requirements. The biggest difference in the two schedules is that MPS specifies what needs to be produced, how much product needs manufactured and when, while the Production Planning schedule specifies how much material is needed to meet the MPS demand. Production planning occurs on a smaller scale too, usually on scales of days and weeks. MPS is broader, often looking months and years ahead. Building a useful long-term forecast requires multiple inputs and necessitates sufficient historical data.
The variability of inputs also complicates the process. An MPS is influenced by supply and demand, product complexity, variations in production processes, accuracy of quality control plans, labor resource constraints, global supply of raw materials and component parts, and a streamlined operations team.
Given that long-range forecasts are combined with the variability of significantly dynamic inputs, a strong MPS is difficult to make. This project focuses on a subset of the overall MPS using a combination of machine sensor data, production results, and fault-based analytics churned through advanced ML techniques to produce predictive outcomes. The ML techniques employed in the paper are presented not to derive a robust model that delivers an MPS methodology, but rather to demonstrate some of the capabilities that ML can provide. A handful of the techniques utilized in this paper include the following:
- Multi-class classification with TensorFlow and scikit-learn.
- Ensemble prediction with Random Forests.
- Deep learning models with Neural Networks.
The outcomes of these techniques only represent a basic example and further experimentation is required. In the following sections, I explain the questions to be answered by this study.
Technology Description
Tier Automotive customers generally utilize Enterprise Resource Planning (ERP) systems to manage data across various business units and departments. According to the Panorama Consulting Group (2020), 33.66% of global ERP systems use is in manufacturing (p.4). The advent of cloud-based ERP solutions makes it simpler for smaller automotive suppliers to implement and deploy them. Nearly 63% of ERP consumers selected them due to the low maintenance needs of Software as a Service (SaaS) systems (p. 17). Furthermore, given the cohesive nature of ERP systems, the data for the study will be confined to the schema and format of the inclusive databases and tables.
The following list of data sets and types is used in the project. Below is a simple table outlining the sources, how large the data sets are, and what data types exist in them. Additionally, notes are available to assist in data understanding.
| Data Sets | Size | Types | Notes |
| Production Capacity | Med (1600 Records) | Str / Int / Dec | Labor to Demand |
| Production History | XLrg (>4000 Records) | Str / Int / Dec / Long | Historical production |
| OEE | Med (1600 Records) | Int / Dec | Performance Efficiency |
| Equipment Failures | Med (1600 Records) | Str / Int / Dec | Machine Downtime |
| Raw Machine Data | XLrg (>4000 Records) | Str / Dec | Raw Sensor Data |
Data Set Descriptions
Production Capacity –
Each manufacturing facility sets a finite production capacity. The value of the capacity is the maximum production output the totality of equipment, labor, and resources can achieve.
Sample:
| Day Number | Production (hrs) | Capacity (hrs) | % Availability |
| 1 | 20.25 | 24 | 84.38% |
| 2 | 19.75 | 24 | 82.29% |
| 3 | 21 | 24 | 87.50% |
| 4 | 8.75 | 24 | 36.46% |
| 5 | 17.25 | 24 | 71.88% |
| 6 | 23.25 | 24 | 96.88% |
| 7 | 22.75 | 24 | 94.79% |
Production History –
Manufacturing production history tallies the past records of produced parts. The production history data set is valuable for building a comprehensive time series population of records that reveal a manufacturer’s capabilities.
Sample:
| Day Number | Pieces Produced | Pieces Scrapped | % Quality Product |
| 1 | 19850 | 1830 | 91.56% |
| 2 | 19160 | 790 | 96.04% |
| 3 | 18900 | 870 | 95.60% |
| 4 | 8710 | 1150 | 88.34% |
| 5 | 18110 | 740 | 96.07% |
| 6 | 25110 | 900 | 96.54% |
| 7 | 20480 | 510 | 97.57% |
OEE (Overall Equipment Efficiency) –
OEE is an aggregation of capacity, historical information, expected output, and represents the efficiency of the equipment which runs the shop floor. Factors like availability, performance, and quality are considered. OEE can be summarized as A*P*Q. Availability * Performance * Quality. (2023 Vorne Industries). The dataset used for the Regression studies compares Availability to the overall recorded OEE.
Sample:
| Availability | OEE |
| 0.84375 | 75.73% |
| 0.822916667 | 76.67% |
| 0.875 | 75.28% |
| 0.364583333 | 32.06% |
| 0.71875 | 72.50% |
| 0. 96875 | 101.00% |
| 0.947916667 | 83.26% |
Equipment Failures –
The Equipment Failures dataset includes information about the downtime of machines. There are categories of downtimes, some planned, others unplanned. The dataset holds the records needed to identify when, how, and perhaps what actions were taken to address the downtime.
Sample:
| Machine_ID | Start_Date | Start_Time | End_Time | Total_Down | Reason_Code | Planned |
| M_0017 | 1/3/2019 | 07:11:22 | 01/03/2019 07:46:40 | 00:35:18 | Die Change | 1 |
| M_0016 | 1/4/2019 | 10:44:05 | 01/04/2019 11:17:08 | 00:33:03 | Off | 1 |
| M_0016 | 1/6/2019 | 01:09:47 | 01/06/2019 02:47:44 | 01:37:57 | Die Change | 1 |
| M_0019 | 1/8/2019 | 07:18:56 | 01/08/2019 07:51:01 | 00:32:05 | Planned Maintenance | 1 |
| M_0002 | 1/12/2019 | 21:52:15 | 01/12/2019 22:25:51 | 00:33:36 | Product Error | 0 |
| M_0017 | 1/13/2019 | 01:49:48 | 01/13/2019 02:34:35 | 00:44:47 | Line Stop | 0 |
Raw Machine Data –
The raw machine data provides a population of sensor outputs for multiple pieces of equipment. The information is studied with ML to cluster and categorize potential correlations. It is good data to foster awareness of how manufacturers struggle with big and puzzling data sets.
Sample:
| Machine_ID | Failure | AVG. | Sensor_1 | Sensor_2 | Sensor_3 | Sensor_4 |
| M_0001 | 0 | 6.934753 | 13.49161 | 9.318098 | 10.89609 | 8.401777 |
| M_0002 | 0 | 5.50641 | 6.352284 | 12.18626 | 7.757645 | 5.330642 |
| M_0003 | 0 | 5.689135 | 2.982099 | 3.522445 | 9.947512 | 3.76125 |
| M_0004 | 0 | 5.467937 | 10.9881 | 2.669871 | 5.589539 | 6.975189 |
| M_0005 | 0 | 5.508549 | 13.18174 | 1.179302 | 5.485443 | 5.973635 |
| M_0006 | 0 | 5.63369 | 11.99635 | 6.031708 | 3.979602 | 14.74294 |
| M_0007 | 1 | 4.510002 | 6.984421 | 6.256924 | 6.688669 | 0.43979 |
| M_0008 | 1 | 5.064395 | 7.813207 | 10.88588 | 12.19277 | 9.667473 |
Platform Technologies
The platform technologies for analysis include the following:
| Technologies | Size | Notes |
| Plex ERP | XLrg | ERP, MES, QMS |
| SQL | XLrg | Sql db, tbl, SQL scripts |
| SSMS | N/A | Managing SQL data |
| ODBC | N/A | Connector to ERP |
| API | N/A | Connector to ERP |
| Apache Spark | N/A | Platform for ML |
| Databricks | N/A | Platform for ML |
Plex ERP, a cloud-based enterprise resource planning system tailored for manufacturing operations, excels in providing comprehensive integration throughout manufacturing processes. From order management to production scheduling, inventory control, and quality management, Plex ERP streamlines operations with real-time insights and process automation. Its suitability for managing intricate manufacturing data in the automotive industry makes it an ideal choice. For this study, data was anonymously extracted from Plex ERP.
Fundamental tools for efficient database management and querying, SQL and SSMS play essential roles in the project. SQL, a standard language for managing relational databases, handles tasks like data retrieval, manipulation, and schema modification. Meanwhile, SSMS serves as a robust integrated environment for managing SQL Server databases. These tools, chosen for their capabilities in data storage, retrieval, and analysis, were employed to store the extracted Plex ERP data.
In the realm of data connectivity, ODBC serves as a standard interface for connecting with databases, while APIs facilitate communication and data sharing among different software applications. Together, ODBC and API are crucial components of the project, enabling seamless communication between diverse data sources and applications. ODBC played a key role in establishing a connection between the SSMS database and tables and Plex ERP. Plex ERP’s multiple libraries of APIs, facilitating HTTPS restful management of various data sources, further enhanced data connectivity.
Apache Spark, an open-source data processing engine, paired with the Scala programming language, offers a fast and versatile cluster-computing framework for big data processing. These tools are instrumental in enabling large-scale data processing, analysis, and transformation, aligning with the project’s requirements.
Databricks, an extension of the Apache Spark founders, stands as a commercialized web-based platform that leverages Spark. It efficiently manages processing clusters and facilitates ML pipeline development in an integrated environment. This platform, chosen for its cohesion and compatibility with Apache Spark, contributes to the project’s success in data processing and machine learning.
ML Modeling Process
Each of the previously identified datasets are flush with possibilities. Assessing the potential needs of Tier Automotive Suppliers based on the datasets is an enjoyable and important component of the modeling process. When examining the questions and hypothetical outcomes, this paper focuses on the following scope:
- How can historical operational, financial, and production-related data be leveraged to improve the accuracy of Master Production Schedules?
- What machine learning algorithms are most effective in predicting and managing variabilities in the Tier Automotive manufacturing facilities?
- What predictive models can assist in the identification of line stoppages, labor shortages, or equipment failures?
I call on the emphasis of Richard McElreath to “start with the causes of the data” (2023 McElreath). The scope of these questions enforces the use Directed Acyclic Graphs (DAGs) and are presented as a causal model to start the study here.
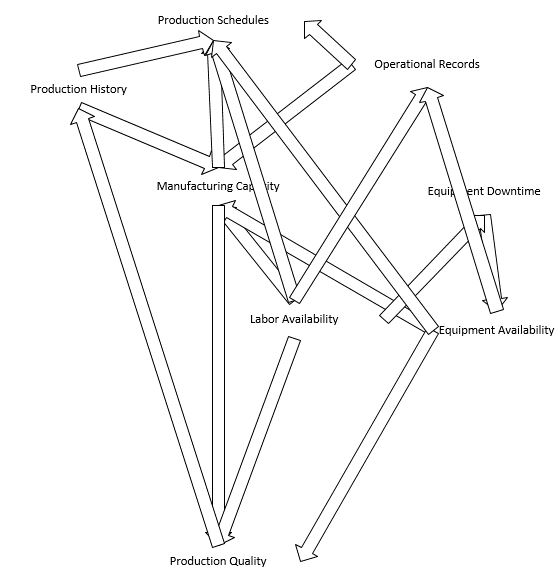
Start with Production History and Operational Records. Each of these populations of information directly affect the Manufacturing Capacity and Production Schedules. Production history dictates what is possible, operational records define what is negotiable. Buckle in the Equipment and Labor Availability and now Manufacturing Capacity becomes heavily influenced by the additional sources. For example, if labor is short, manufacturing capacity is short. If equipment is down, capacity is down. These two in combination with Manufacturing Capacity impact the Production Quality. Quality suffers or flourishes when the three primary drivers are congruently working in parallel. Production Quality in turn determines the Production History while Equipment Availability and Labor Availability influence the operational records where financial details are considered (Labor and Overhead). By understanding the DAG within the scope of my questions, I can pursue Machine Learning models that are useful.
To Continue… please read & download the report here:

This is absolutely fantastic. I think I have some questions, but I am going to read it one more time before I ask them just in case.
LikeLike